
Like the Detailed Project Report in the case of loans, the Business Plan goes into all aspects of the business viz. market definition, production strategy, human resources strategy, information technology strategy, marketing strategy, capital structure, resource mobilisation plan, underlying risks, risk mitigation etc. The Business Plan thus becomes a base document to get a comprehensive idea of what the business is all about, and how it will be built.
A key component of the Business Plan is the financial model, which shows where the revenues and cash flows will come from, how it will be spent, what kind of return the project will yield, and how it will be translated into returns on the capital employed and the equity invested in the business.
Financial Model
- Background
Cash flows used for the investment evaluation come from the detailed financial projections that are made. Three financial statements are prepared – Profit and Loss Account, Balance Sheet and Funds Flow.
Projections for most companies are made for 3 to 5 years. However, when it comes to infrastructure projects, the financial projections are extremely long term – even extending beyond 25 years.
The projections are made in constant rupee terms as well as inflation adjusted terms. The key to interpreting financial projections submitted by a company is to understand the assumptions. With over-optimistic assumptions, it would be possible to justify any investment. The investor reviews the assumptions and ensures they are realistic, before getting on to a serious review of the financial projections.
While the prospective issuer presents the projections as part of the business plan, prudent investers make their own projections. This not only helps them validate the numbers presented by the issuer, but also gives them the flexibility to explore alternate scenarios.
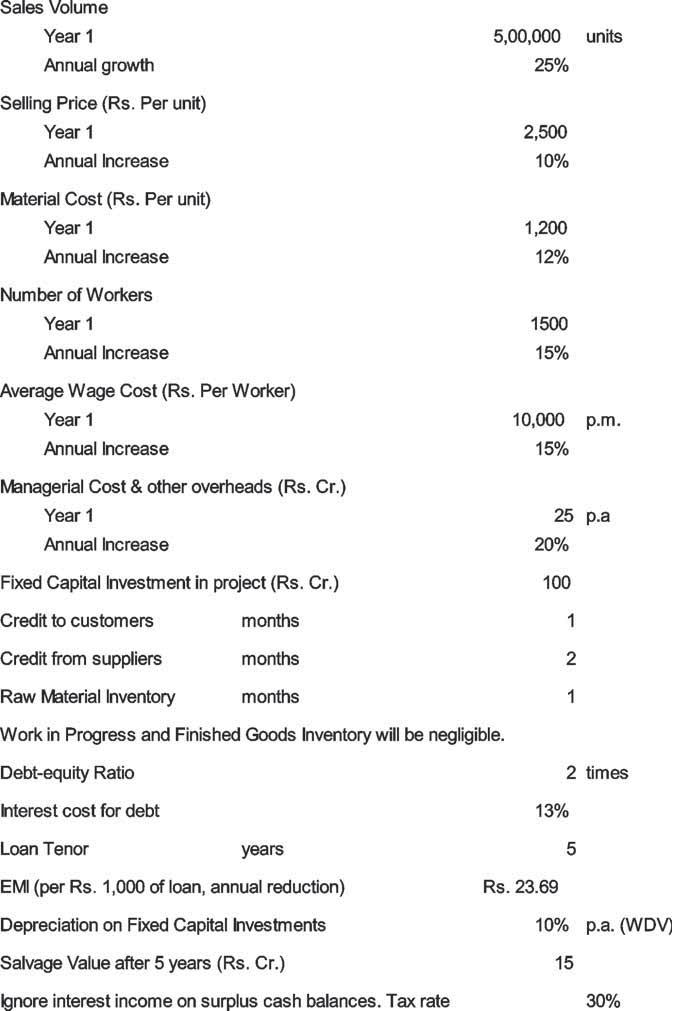
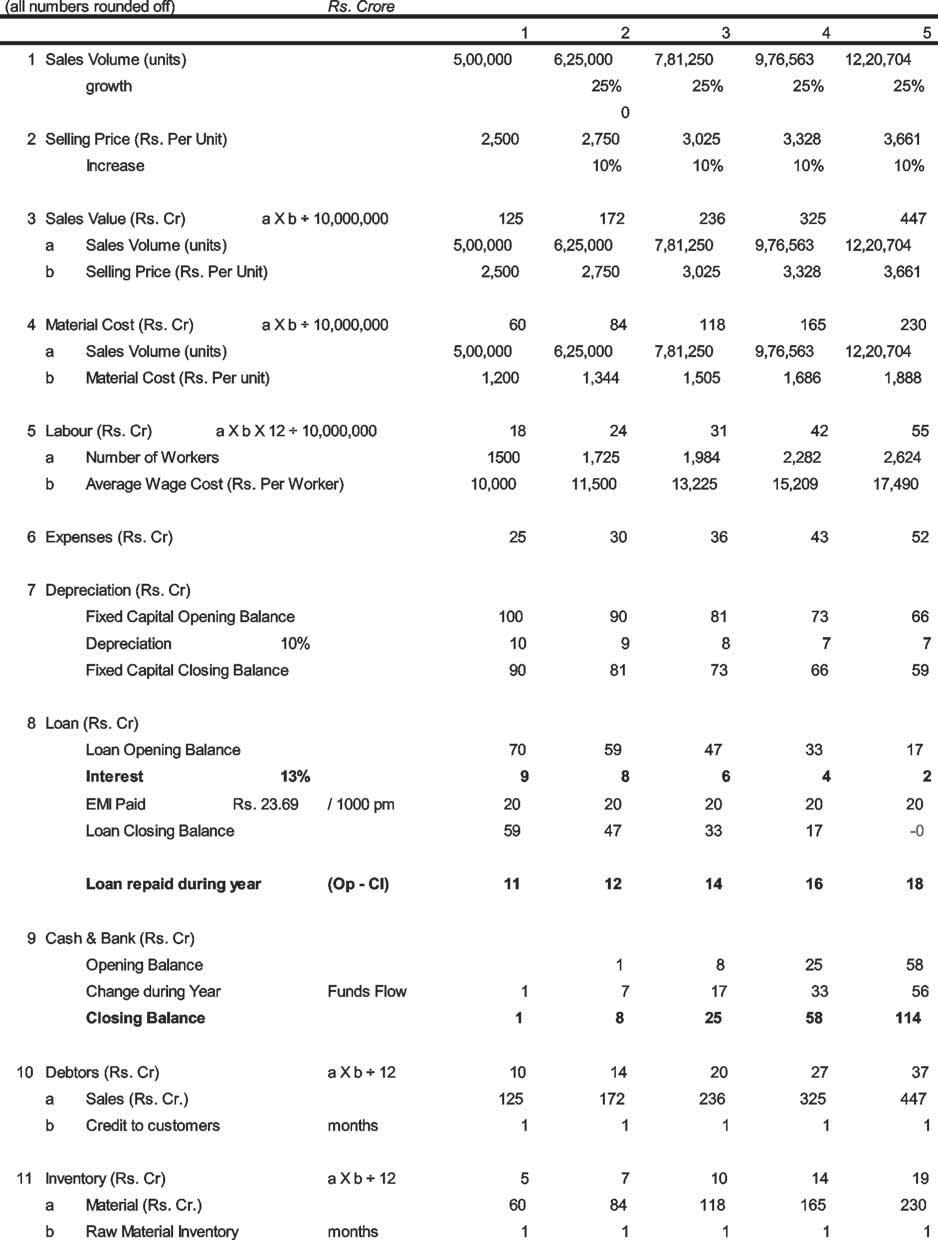
- Assumptions
The entire operations underlying the company, including the cost structure and scale-up plan are captured in the statement of assumptions. A sample is shown in the table below:
Table 1
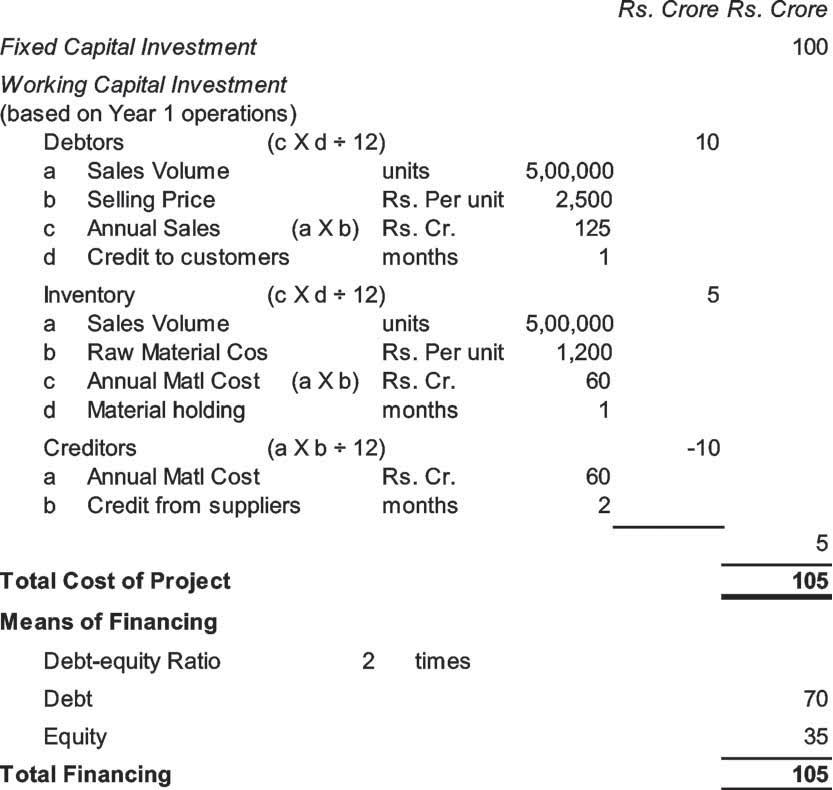
- Cost of Project & Means of Financing
Based on the assumptions, the company’s capital expenditure plan and means of financing can be calculated.
Capital expenditure plan should also include the investment in working capital. As operations expand, working capital investment keeps going up, unless the management does something proactive to control it. For example, it can improve the supply chain and reduce the inventory, adopt Just in Time (JIT) practices or negotiate better credit terms with suppliers and customers.
With a new company, or an existing company proposing a new project, cost of the project is estimated on the basis of first year’s working capital requirement or the working capital requirement when operations have reached a stable level.
Table 3.1 envisages that the cost of project will be financed through a debt-equity ratio of 2:1. Accordingly, the cost of project of Rs. 105 crore is financed through a mix of Rs. 35 crore of equity and Rs. 70 crore of debt. The details are given in Table 3.2.
Table 2
- Projected Profit & Loss Account
The various income and expenditure items are listed in the Profit & Loss account (Table 3.3). Details of the calculated numbers are given in the Workings in Table 3.6.
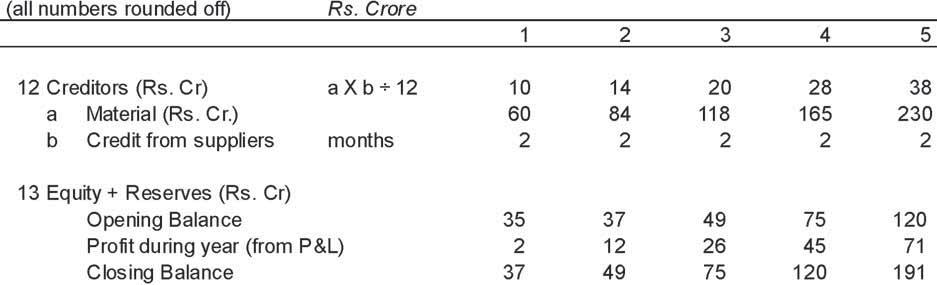
- Projected Balance Sheet
The year-end position of assets and liabilities of the project are given in the Balance Sheet (Table 3.4).
- Projected Funds Flow
The various sources and application of funds during each year are mentioned in this statement (Table 3.5). The total of all sources of funds minus the total of all applications of funds for each year is the change in Cash and Bank position during the year. In Table 3.5, applications of funds are shown with a negative sign. Therefore, the column total gives the change in Cash and Bank position during the year.
Table 3.4
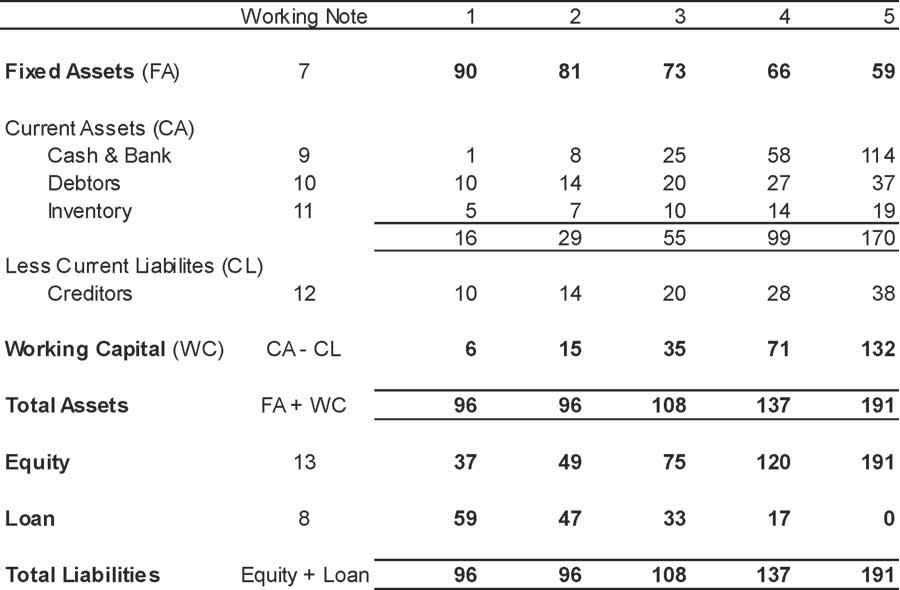
Table 3.5
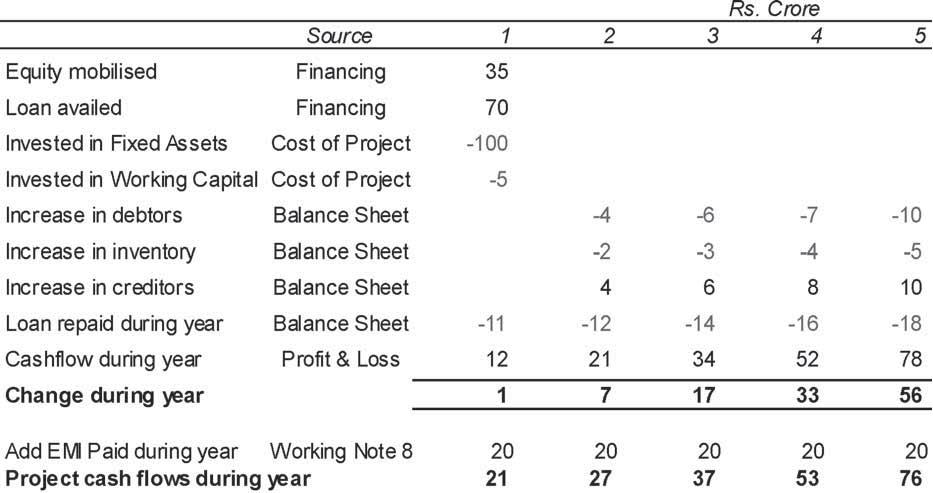
Table 3.6
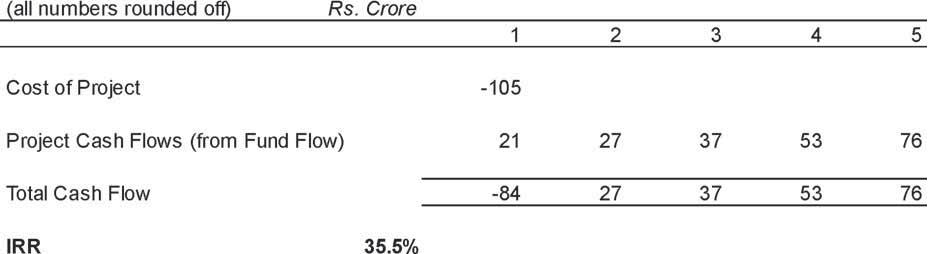
- Project IRR
As seen in Table 3.7, the project yielded an IRR of 35.5%. Since cash flows are post-tax, the calculated IRR too is post-tax.
Table 3.7
Project IRR
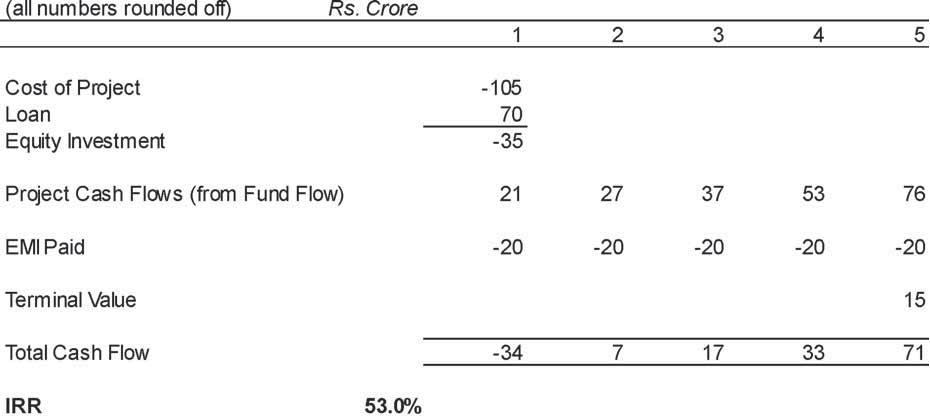
- Equity IRR
The return for equity investors is 53%, as seen in Table 3.8. Since the project IRR (35.5%) is much higher than the cost of debt (13%), the equity IRR is very attractive.
Table 3.8
Equity IRR
- Loan Servicing Capability
Loan servicing ability is assessed through certain ratios:
Interest Coverage Ratio (ICR):
This is calculated as EBIT ÷ Interest as shown in Table 3.9.
Table 3.9
Interest Coverage Ratio
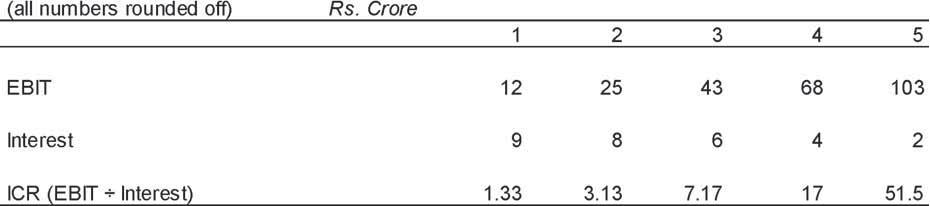
Interest coverage of 1.33 in year 1 means that even if the profits (EBIT) of the company were to go down by (1.33 – 1) ÷ 1.33 i.e. 25%, it will have adequate profits to pay interest. (The legal position is that the company has to service its debts even if the company does not earn profits)
Debt Service Coverage Ratio (DSCR):
There are two elements of debt servicing – interest and principal. Debt Service Coverage Ratio compares the debt servicing requirements with the cash flows (EBIT + Depreciation) of the project, as shown in Table 3.10.
Table 3.10
Debt Service Coverage Ratio
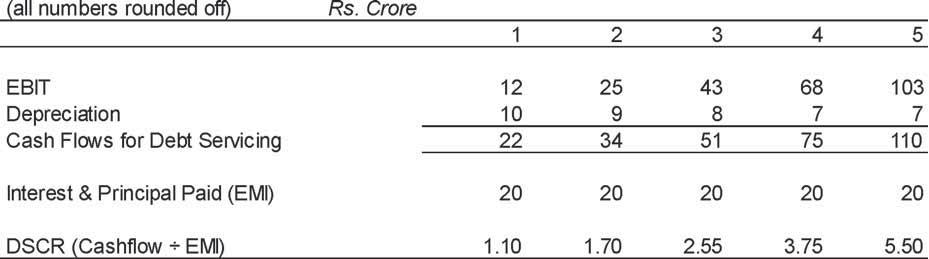
DSCR of 1.1 in year 1 means that even if the cash flows (EBIT + Depreciation) of the company were to go down by (1.1 – 1) ÷ 1.1 i.e. 9.1%, it will have adequate cash flows to service the debt. (The legal position is that the company has to service its debts even if the company does not have cash flows)
Long Term Debt Service Coverage Ratio (LDR):
The DSCR is different for each year. In the case of LDR, the total position over the life of the loan / project is considered.
For example, from Table 3.10, it can be seen that the total cash flow for debt servicing over the 5 years is 22+34+51+75+110 i.e. Rs. 292 crore. Debt servicing payments during the period amount to Rs. 100 crore.
LDR is Rs. 292 crore ÷ Rs. 100 crore i.e. 2.92.
LDR is particularly useful in infrastructure projects. Lenders seek to ensure that LDR is at least 1.0 over the loan period, which would be a few years shorter than the project life. The cash flows during the project life after the loan period are a cushion to ensure that the lenders are repaid.
Even equity investors assess the loan servicing ability of the company, because it gives an indication of how stable and safe the capital structure is. Any problems with loan servicing will pull down equity valuations, and might even make the equity shares illiquid.
Another structure is where an existing company takes up an expansion or diversification project without creating a new company. In such cases, loan servicing can come from the project itself or the other operations of the company. Assuming other operations are profitable, this is much safer for the equity investor. The downside is that the company’s other operations will push up the valuation at which the shares are available for investment by the PE fund. Further, if the new project is a diversification, the PE fund will not get the pure sector exposure it may be looking for.
Related: What is a Business Model?
- Valuation
Table 3.6 assumed initial equity of Rs. 35 crore. Let us suppose that each share was issued at Rs. 10. In that case, the company would have issued 3.5 crore shares.
The calculation of EPS, Cash EPS and Book Value are shown in Tables 3.11, 3.12 and 3.13 respectively
Table 3.11
Earnings Per Share
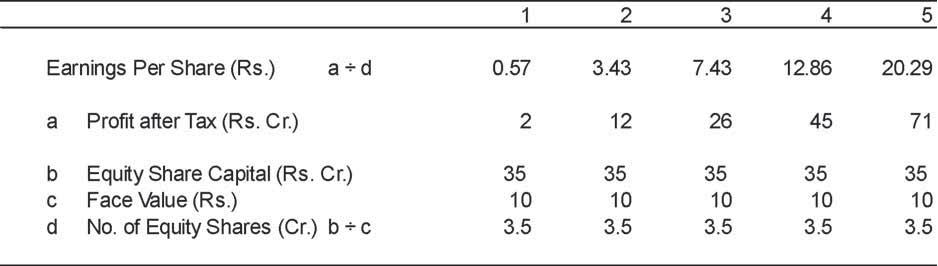
Table 3.12
Cash Earnings Per Share
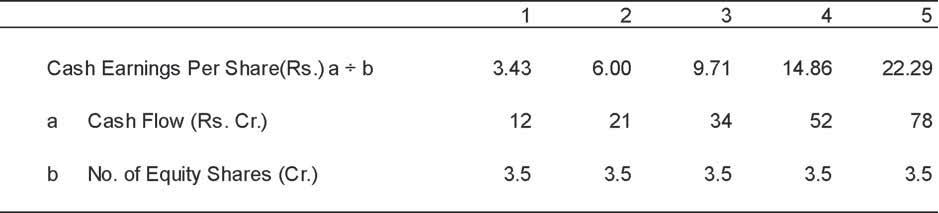
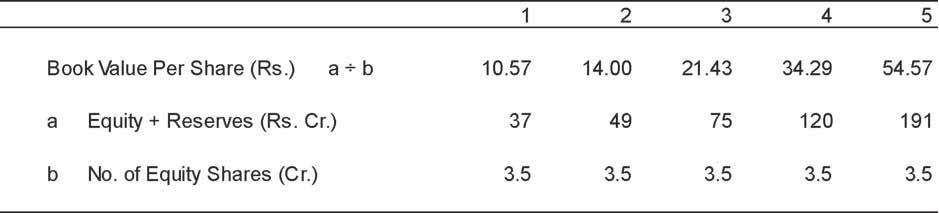
Table 3.13
Book Value Per Share
Timing of share placements is critical. As the company keeps stabilising its operations and profitability improves, the price of its share will keep going up.
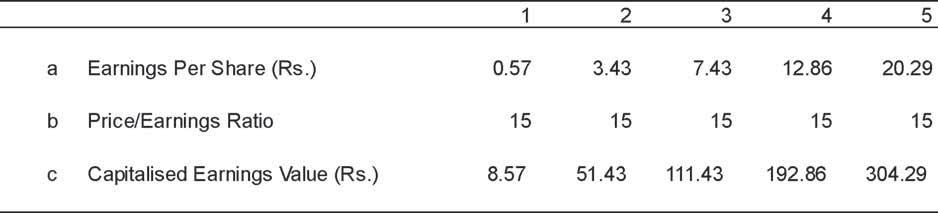
Let us suppose that based on the P/E ratio of similar companies traded in the market, this company’s P/E Ratio ought to be 15 times. Table 3.14 tracks the growth in P/E Capitalised Earnings Value of each share of the company, assuming a constant Price/Earnings multiple of 15 times. It is calculated as EPS multiplied by the P/E Ratio each year.
Table 3.14
P/E Capitalised Earnings Value Per Share
It stands to reason that companies should consider issuing capital in stages, to benefit from the rising valuation. However, every round of capital mobilisation entails investment of time and money. Further, if the financial markets are not favourable at the time of proposed placement, the resource mobilisation exercise can fail or happen at a significant discount to the fair valuation.
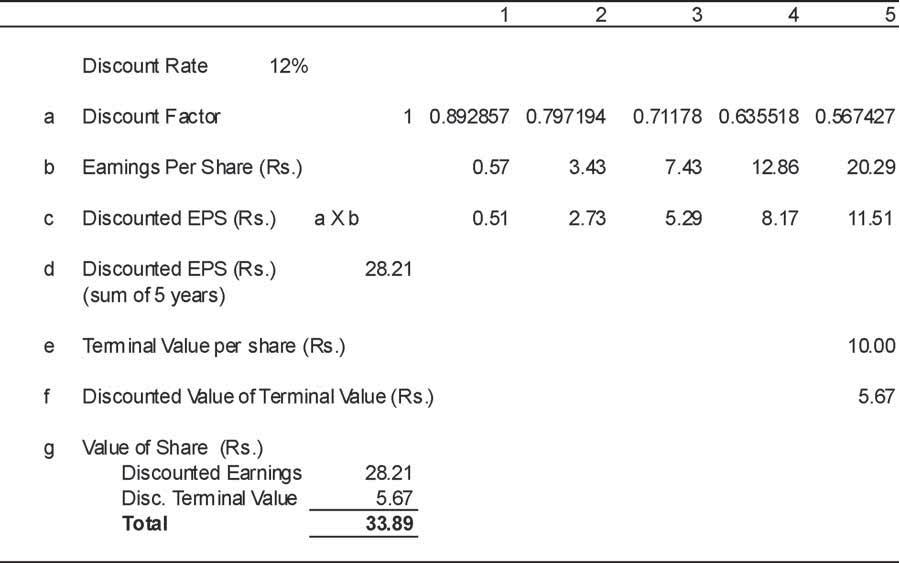
Another approach to valuing the company’s shares is through Discounted Cash Flow (DCF) method. This is illustrated in Table 3.15. The discount factor is calculated as (1 / (1 + 12%) ^1 for Year 1; (1 / (1 + 12%) ^2 for Year 2 and so on.
The terminal value figure is an assumption. It is discounted using the relevant discount factor for Year 5.
The DCF value of each share comes to Rs. 33.89. Investors are normally uncomfortable if too much of this value can be attributed to the terminal value. Their preference is for valuation to be driven more by the earnings, rather than the terminal value.
Table 3.15
Value of Share based on DCF
The fair value of each share at time 0 can be calculated based on weighted average of DCF and Book Value, as shown in Table 3.16.
Table 3.16
Fair Value per Share
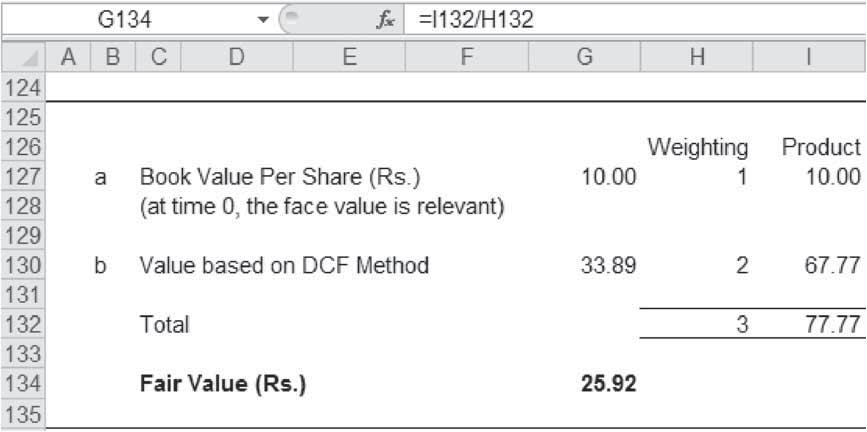
RBI insists that shares are placed with non-residents at a valuation that is at the minimum, the fair value; at book value, if it is higher.
- Sensitivity Analysis
Financial analysts assess how the financial numbers change with respect to changes in assumptions and identify the parameters that are most sensitive. Then they create a sensitivity table that shows what would be the value of a financial number for different combinations of assumptions (maximum of 2 parameters at a time).
Table 3.17 shows the sensitivity of PAT (Year 1) to changes in sales volume and selling price.
Table 3.17
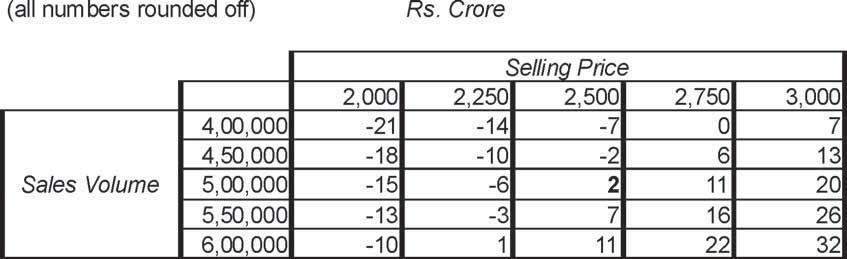
Sensitivity: PAT (Year 1) with Sales Volume & Sales Price
The base case PAT of Rs. 2 crore, with sales volume of 500,000 units and selling price of Rs. 2,500 per unit is shown in bold.
While sensitivity analysis is a powerful tool, each table can only show one financial number (PAT of Year 1 in the above table), and its sensitivity to a maximum of 2 parameters (Sales volume and Selling Price in the above table).
Alternately, any number of financial numbers can be included in the sensitivity table, however, sensitivity to only one parameter can be taken in a single table. For example, one can have financial numbers such as Sales revenue, EBIT, PBT, PAT and Cash Flow in different rows, while each column will show the values for one Selling Price level (or Sales volume or other parameter).
The impact of change in multiple parameters on various financial numbers can be shown by building scenarios.
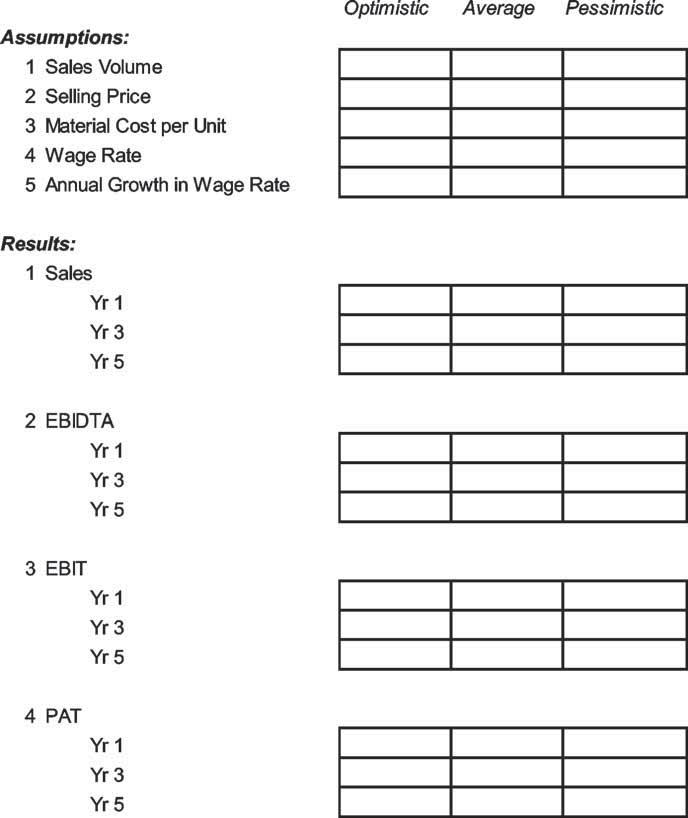
Building Scenarios
Each scenario represents one combination of assumptions. Any number of assumptions can be used in the scenario e.g. selling price, sales volume, material cost, labour rate, inflation etc.
In order to focus management attention, each scenario is given a name e.g. Optimistic, Pessimistic and Average; or No competition, Some competition and Severe competition.
For every scenario, any number of financial figures can be shown. Only the key figures that impact management decision making are shown in the scenarios. A sample of scenarios is shown in Table 3.18.
Table 3.18
Scenarios


